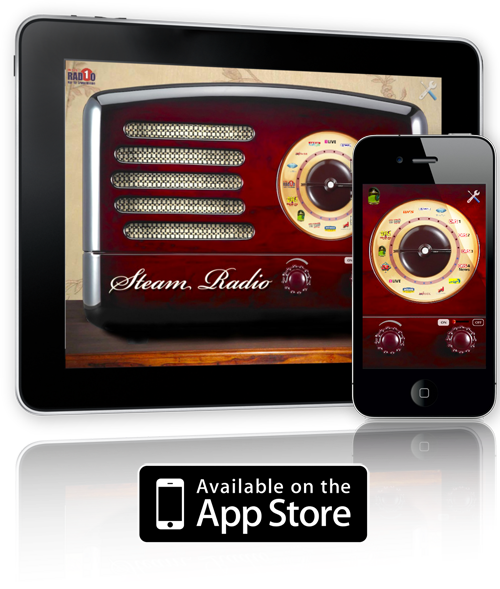
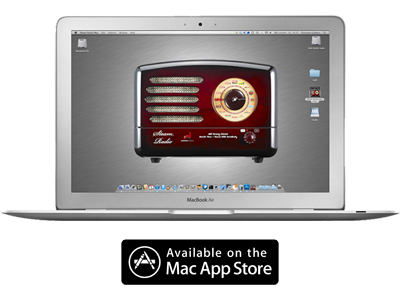
I have to fiddle around with Microsoft Research’s Dynamic Data Display for a project to display measurement data.
It did not take very long until I ran into problems with performance. Using e.g. a DataTable object as Data Source for the Graph would work well for around 100 data points give or take, but when running in fullscreen window and with say 10000 data points, it would just freeze your application and render it unusable.
Now as a lot of folks had similar problem, as stated in many forums, I finally stumbled across the “Simulation” Example project, which did not seem to have such problems. Works like a charm with no lagging whatsoever, and using thousands of data points.
The only difference I could find, is that this example uses a different data source object, the “ObservableDataSource” from DDD DataSource definitions, and it’s adding new points in the chart directly to the data source object. Using this approach, it removed all my performance problem. So maybe it will save your project as well.


Thanks! It’s really work! (: